


“I used to think that if there was reincarnation, I wanted to come back as the president or the pope or as a .400 baseball hitter. But now I would like to come back as the bond market. You can intimidate everybody.” – James Carville
Investors experienced absolutely stellar returns during the first six months of 2021. And they were fairly broad-based. Specifically, large cap U.S. stocks did very well as illustrated in the roughly 15% advance in the S&P 500. Small cap U.S. stocks did even better with the Russell 2000 gaining almost 19% for the period. While it’s true that we did see a rotation away from more growth-oriented stocks to the more cyclica- oriented or value camp in the first half of the year, both generated handsome returns with the Russell 1000 Growth Index and the Russell 1000 Value index climbing roughly 13% and 17%, respectively. Growth stocks closed the period with a very strong showing in June.1 Even international stocks posted healthy returns, albeit they lagged the domestic indices again this period. So, the success in equity land was widespread.
The bottom line is that the S&P 500 pushed through once again to all-time highs in the face of some major wall of worry issues it confronted at the onset of 2021…namely, a contested election, worries about the probability of stemming the tide of the COVID-19 pandemic, and fears that the outcome of proposals to provide monetary and fiscal stimulus to see us through the temporary shutdown would fall short. Each of these issues was resolved in better-than-feared fashion. As it became clearer that the U.S. was transitioning ever closer to a comprehensive reopening, the market cheered, and here we are. Is the advance simply based on adrenaline and giddy sentiment that we can get back to dining out and other activities or is it lasting and real and based on solid data? Based on the metrics we follow, we believe it is real and sustainable. In terms of the fundamental trends in earnings and the economy, we are in the midst of one of the most robust recoveries we have seen in decades. Yes, growth is likely to soften from peak levels at mid-year, but only to a still healthy pace in the second half and on into 2022. Rates have risen but remain at low levels, which is supportive of current stock market valuation. That said, accelerating inflation is a concern on investors’ minds as they worry that this could inspire falling price-to-earnings ratios, aka declining stock market valuation, if it gets out of hand.
At this juncture, we believe it should stabilize at higher but still supportive levels. We are heartened that the bond market seems to agree with us. At prior periods when stock markets peaked in 2000 and 2008, the so-called bond vigilantes pushed intermediate and longer term Treasury bond rates up and forced the Federal Reserve, in lagged fashion, to raise short-term rates and choke economic expansions that were underway. The chart below brings this to life and demonstrates there is usually a several-month lag between the vigilantes taking charge and the Fed taking action in reactive fashion.
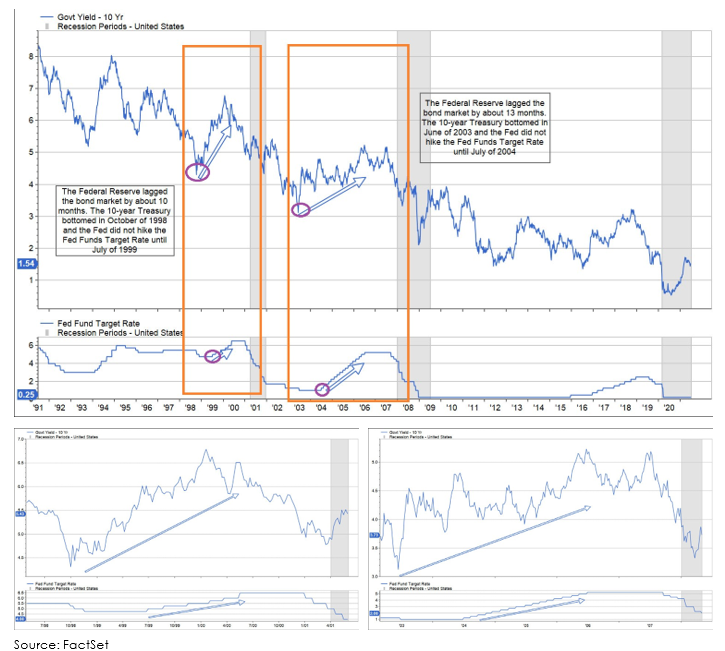
Hence the quote above from James Carville that if reincarnated, he would like to return as the bond market given that it intimidates everybody. The 10-year Treasury today remains quite low at 1.5%, and this calm in the bond market suggests to us that inflation is likely to calm as well.
What’s Next?
The table below outlines our base case target for the S&P 500 and the economic and earnings environment that we see in store as driving that result…healthy real GDP growth of 6%-7% for 2021; inflation and rates that rise but remain at healthy levels; and S&P 500 earnings that approach consensus expectations of $211 per share. Should this occur, we believe the market can sustain current P/E multiples of 22 times earnings and generate a comfortable high, single-digit return. We assign a 65% probability to this outcome.
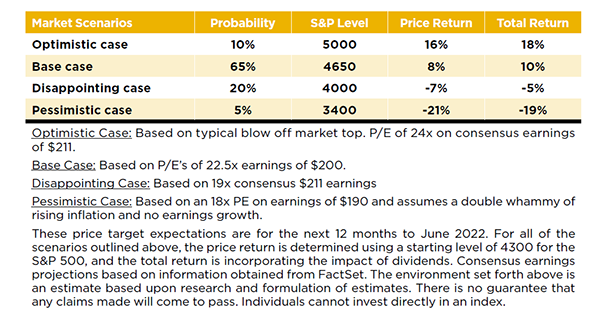
We also see a more optimistic case should inflation and rates rise in more benign fashion than feared, and investor emotions drive multiples to even higher levels. We assign a 10% probability to this even rosier scenario.
The table also illustrates several disappointing scenarios that could play out should inflation and rate increases appear more problematic than we expect. Again, we assign very low probability to this occurring.
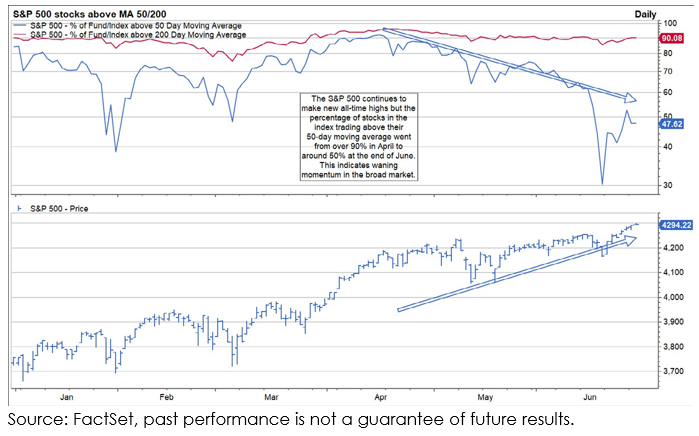
As you see, we remain constructive regarding potential returns in the coming 12 months. However, we would not be surprised to see a correction or pause in the market in the second half of 2021 given the strong returns in calendar 2019 and 2020, and the excellent start in 2021. We’ve observed the softening in stock price momentum exhibited in the falling percentage of stocks in the S&P 500 trading above their 50-day moving average as we moved through 2021 and have noted that leadership in the more aggressive areas of the market has plateaued as of late…this supports the view that the market may be in want of a temporary time out.
Or, we might just see rolling corrections in certain sectors of the market, much like we saw the 10% pullback in technology earlier in the year before closing the second quarter in a better note.2 The point is, we do not anticipate a straight line to higher highs but do believe they will occur in a reasonable timeline. Further, we see virtually no signs of a market top and therefore do not view a short correction as warranting anything other than staying the course and staying invested.
The Pillars of Support
We have often shared the rolling wall of worry with you and provide an update on that front below.
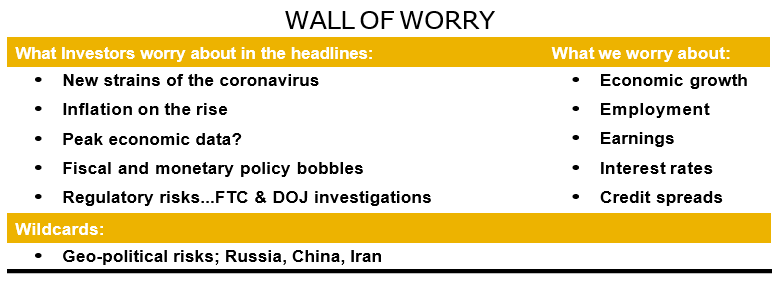
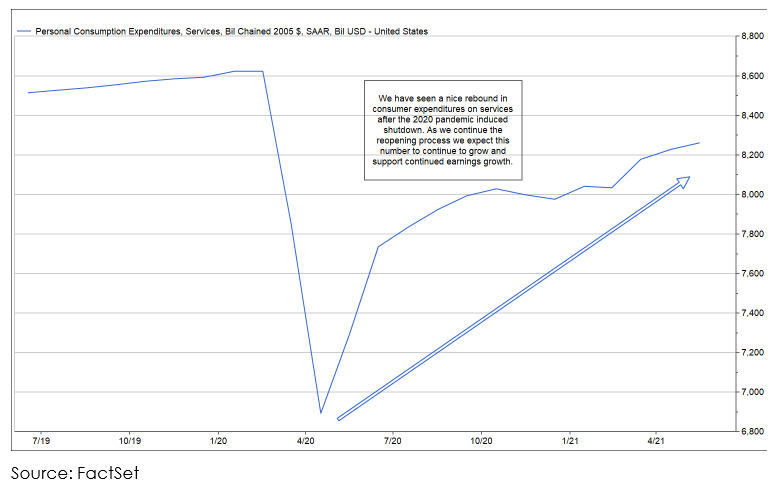
That list includes concerns such as rising inflation and a potential peak in economic data. At this juncture, we believe that they will adjust to levels still supportive of further advancement in the market. We are comforted on the inflation front that rising labor productivity, which serves to offset wage increases, is also quite robust and that certain product categories that have influenced the inflationary figures in the last several months (e.g., price of used cars) are not those that feed rising inflation expectations for the longer term. We will stay tuned on this front for it is an item that could reduce profit margins and earnings if it proves to be higher and more sustainable than we expect. The key on this table, though, is that we do not get concerned about the headline wall of worry items unless they spill over and truly impact the items on the right-hand side of the page…economic and earnings growth, which fall at the top of the list. These metrics continue to pace at solid levels and serve as pillars of support for our positive view. The manufacturing sector has been growing nicely for some time. With the economy just now comprehensively reopening, the service sector is bouncing back nicely which should serve to keep us on a good earnings path.
Wrap-Up
With a broadening economy supported by a more comprehensive reopening and resumption of consumption activities in the service sector and rising employment, we look for continued growth in earnings and the market. We might take a breather for a moment, but we look for higher highs and high, single-digit returns in our Crystal Ball outlook over the next 12 months.
Sources:
1,2FactSet
The S&P 500 Index is a market-value weighted index provided by Standard & Poor’s and is comprised of 500 companies chosen for market size and industry group representation.
The Russell 2000 index is an index measuring the performance of approximately 2,000 smallest-cap American companies in the Russell 3000 Index.
The Russell 1000 Growth Index is the largest 1,000 growth stocks by market capitalization. Growth is determined by the I/B/E/S earnings growth rate two-year forecast and sales-per-share five-year historical sales.
The Russell 1000 Value Index is the largest 1,000 value stocks by market capitalization. Value is determined by Book-to- Price ratio (B/P).
Individuals cannot invest directly in an index. Index returns do not include fees or expenses.
Investing in securities involves risk of loss, including loss of principal, that clients should be prepared to bear. Investing in small-cap company securities may be more volatile than investing in larger, more established companies.
This commentary is limited to the dissemination of general information pertaining to Mariner Platform Solutions’ investment advisory services and general economic market conditions. The views expressed are for commentary purposes only and do not take into account any individual personal, financial, or tax considerations. As such, the information contained herein is not intended to be personal legal, investment or tax advice or a solicitation to buy or sell any security or engage in a particular investment strategy. Nothing herein should be relied upon as such, and there is no guarantee that any claims made will come to pass. Any opinions and forecasts contained herein are based on information and sources of information deemed to be reliable, but Mariner Platform Solutions does not warrant the accuracy of the information that this opinion and forecast is based upon. You should note that the materials are provided “as is” without any express or implied warranties. Opinions expressed are subject to change without notice and are not intended as investment advice or to predict future performance. Past performance does not guarantee future results. Consult your financial professional before making any investment decision.
Investment advisory services provided through Mariner Platform Solutions, LLC (“MPS”). MPS is an investment adviser registered with the SEC, headquartered in Overland Park, Kansas. Registration of an investment advisor does not imply a certain level of skill or training. MPS is in compliance with the current notice filing requirements imposed upon registered investment advisers by those states in which MPS transacts business and maintains clients. MPS is either notice filed or qualifies for an exemption or exclusion from notice filing requirements in those states. Any subsequent, direct communication by MPS with a prospective client shall be conducted by a representative that is either registered or qualifies for an exemption or exclusion from registration in the state where the prospective client resides. For additional information about MPS, including fees and services, please contact MPS or refer to the Investment Adviser Public Disclosure website (www.adviserinfo.sec.gov). Please read the disclosure statement carefully before you invest or send money.
Investment Adviser Representatives (“IARs”) are independent contractors of MPS and generally maintain or affiliate with a separate business entity through which they market their services. The separate business entity is not owned, controlled by or affiliated with MPS and is not registered with the SEC. Please refer to the disclosure statement of MPS for additional information.