


“We’re runnin’ outta time
So, tonight we’re gonna party like it’s 1999.”
– Lyrics from Prince’s song and album of the same name, “1999”
The inspiration for famous singer Prince in producing his hit song “1999” emanated from a documentary he saw about Nostradamus, a 16th century French astrologer who predicted various future global catastrophes, including several Armageddon-like prophecies in the “new millennium,” or post-2000 period. When he saw this telecast about Nostradamus and his book “Les Prophéties” filled with predictions of rather scary future events, Prince was moved to write lyrics and compose a more upbeat tune urging us all to party while we can…“like it’s 1999.”1
Now, Nostradamus and Prince feared horrible natural and nuclear-oriented disasters in the new millennium when writing their book and song, respectively, not a so-called bursting of the technology bubble and associated meltdown in technology stocks in March 2000 on the heels of the melt-up in dot-com companies in 1998/99. The timing of the 2000 disaster in tech land and the message in Prince’s lyrics are simply coincidental.
No Parallels Between Tech Meltdown of 2000 and Today
Interestingly, though, the media today seem to be channeling this same short-term focus and message in trumpeting ripe conditions for a Nostradamus-level meltdown in the Magnificent 7 tech-oriented stocks that have largely driven the strong returns in the S&P 500 over the last year. They are suggesting that we are in fact approaching bubble-like valuations in technology stocks, much like those late ’90s dot-com days when a tech company didn’t need revenues or earnings to achieve $1 billion market cap overnight. A business plan on the back of a napkin and dot-com in your signage would do the trick. Remember that old 2000 joke about Yahoo? “How did Yahoo come up with the name? It’s what investors yell when they sell it to some fool for $400 per share!” Comparisons are being drawn that equate the then-prevailing likelihood of the 70% collapse in the tech-laden Nasdaq in 2000 to some sort of perceived rising probability of such an impending plunge today. We feel this is off base and misguided thinking.
Conditions between these two periods simply are not comparable! AI truly is driving a huge transformation in processing infrastructure and a huge upgrade cycle with runway. The companies that comprise the Magnificent 7 are large, established companies that have revenue growth in 2024 estimated to be four times that of the average stock in the S&P 500 and 2024 projected earnings growth more than twice that of the Index.2 They are real. More on specifics in a bit. Suffice to say for now that the media’s hype contained in the parallels that they are inaccurately drawing between conditions today in the technology industry to those of 1999-2000 remind me of the lyrics above in Prince’s song about partying before things turn ugly. Like the Prince song, the tech skeptics out there seem to be telling us we better enjoy life and the inflated gains right now because good times won’t last, and that disaster is right around the corner.
Our “Hold Your Ground” View Prevails
Let me be clear: we think these exaggerated comparisons are just that…hype. They are NOT grounded in financial reality and the facts. We believe the strong returns that we’ve seen in the market in 2023 and early 2024 are warranted and based on solid fundamentals. We feel the same about the returns generated specifically by the Magnificent 7 and by the technology sector in general. They have flourished for good reason. Please do not interpret this as a blind endorsement or assertion that risks are absent in these stocks and the market in general. Of course, we’ll see intermittent corrections in these seven stocks, in the technology sector overall, which has led S&P 500 returns for some time, and in the broader general market—just as we normally do and particularly after a hard run like this. After all, it is normal to see a 10%+ intra-year correction on average every year in the S&P 500.
Sure, one needs to evaluate position sizes and consider rising risk levels if these Magnificent 7 holdings have become overweight and too large a part of one’s portfolio after the success they have had over the past year. Success, I might add, that few experts saw coming. Unlike our message to embrace growth stocks in 2023 and 2024 and to blend them in nicely with some complementary value stocks in balanced fashion, many were recommending avoiding exposure to the Magnificent 7 and growth-oriented names in general. That “expert” advice hasn’t worked out too well. In our internal equity strategies, we maintained reasonable exposure to these stocks in 2023 in the face of skeptics’ contrary views. We weren’t overweight the group relative to their weighting in the S&P 500 but rather managing these positions closer to equal or market weight in most of our internal stock strategies.
We believe continued exposure to these stocks is warranted, in our view, as of this writing, as is maintaining clients’ targeted stock allocations at their normal long-term levels. While we have made some adjustments to our position sizes in these various seven stocks based on their disparate fundamental, valuation and technical metrics, we do maintain holdings in all of them in our actively managed internal equity strategies at present. Further, our “hold your ground” view—our recommendation to maintain targeted stock exposure at normal long-term strategic levels—prevails even as the S&P 500 has hit new highs.
We Expect a Solid Year for Stocks in 2024
Bottom line, we look for a solid year in stocks and maintain a 5,200 to 5,400 price target for the S&P 500 by the end of 2024.
2024 Base Case-Back to Normal
Expected Environment
- Real GDP growth is in a range of 1.5%-2%.
- Federal Reserve cuts rates three times or more in 2024. Longer-term rates settle in a range of 3.75%-4.2%. However, increased volatility could see that range widen to 3.25%-4.50%.
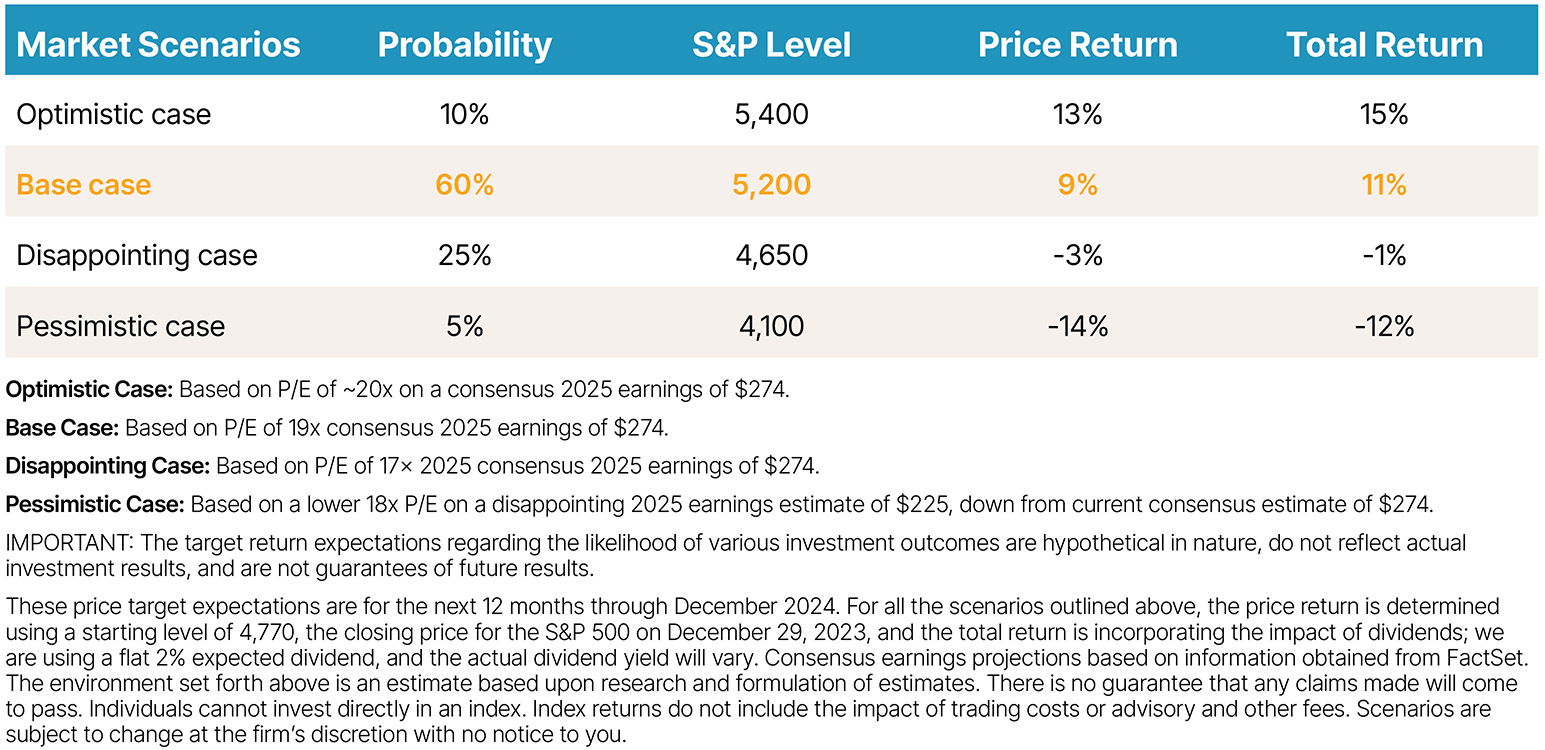
Our theme this year is “Back to Normal” for the financial markets. To wit, our S&P 500 target equates to a more normal or average S&P 500 return in the high single-digit to low double-digit level, when including dividends. This forecast is based upon our expectations for more normal gross domestic product growth in the 2% range following a year when fears of recession were running unusually high. It embraces a view that the Federal Reserve will pause interest rate hikes, which were a headwind last year, at normal or average fed funds rate levels and cut several times in the second half of the year as inflation continues to calm to more normal levels. We look for the 10-year Treasury yield to stabilize in a more normal range of 3.5% to 4.75% after hovering at well below normal levels for much of the period following the 2007/08 housing implosion. For perspective, the average 10-year Treasury yield going back to the late 1800s is 4.75%.
In related fashion, we look for more normal levels of S&P 500 earnings growth in the 8% to 10% range in 2024 on the heels of last year’s relatively rare fear that earnings might soften considerably. We attach what we perceive to be a reasonable forward price-to-earnings (P/E) level of 19 to 20 times to consensus earnings—and voilà, 5,200 to 5,400 is the product of this math in terms of our expected S&P 500 price level. We assign a 70% probability to this outcome. We do assign a 30% probability to flat or negative returns, as you see in table above, should inflation remain sticky and/or economic growth fall short, which might cause earnings to disappoint and P/E multiples to contract. These disappointing results, however, are a relatively low probability, and our worst-case expectations, while not fun, are not devastating in nature. This is healthy risk/reward from our lens.
Broader-Than-Appreciated Market Success in 2024
We must admit that the market has sprinted out of the New Year blocks in swifter fashion than we would have expected this year. The S&P 500 has advanced in both January and February, marking a period of four consecutive months of gains in the Index and representing a rally of more than 25% off the October 2023 lows.3 On a year-to-date basis, through the end of February, the S&P 500 is up roughly 8% and as of this writing, its price level now stands at 5,137,4 so we are well on our way toward our target of 5,200 to 5,400 for the entire year. Tech has led the way, with the S&P 500 Technology sector advancing over 12% so far this year and with the Magnificent 7 contributing almost half of the Index’s overall return. This, of course, is serving to continue to feed tech skeptics’ warnings that a bubble is developing and risk levels are rising as the S&P 500 continues to hit new highs and is perceived to be driven by narrow, concentrated leadership.
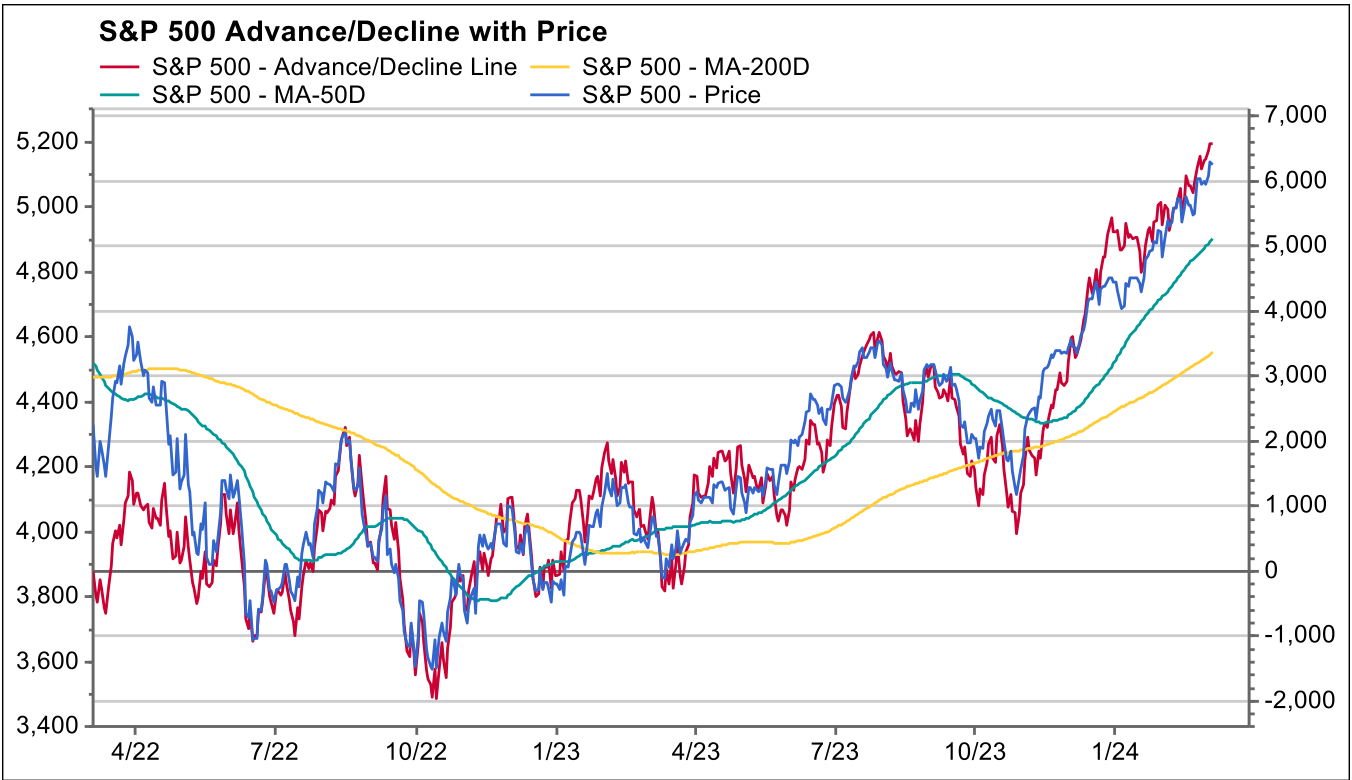
Our take on this is, as usual, a bit different from that of the herd. We would note that the list of companies participating in the market’s success is a bit broader than appreciated. Ten of the 11 S&P 500 sectors are in the green this year; only the Utilities sector is down in the first two months. Roughly 70% of stocks are trading above their 50-day and 200-day moving averages.5 This is a level we like to see to have confidence that a bull market advance can be sustained. The advance/decline line is in a nice uptrend. The key risk-on sectors of Consumer Discretionary stocks and Industrial stocks, both of which have major constituents that are growth oriented and tethered to solid economic trends, remain in nice price uptrends.
This does not represent a picture of narrow leadership and a stock market going up on the backs of only a handful of names while all else suffers. When that happens, we refer to it as negative divergence, and that is a red flag. Such a red flag is dormant at present. The positive slope and trend in the advance/decline line alone tells you that many stocks are doing well right now. We would like to see the market pause a bit here, though, rather than rally significantly further in melt-up fashion. We would prefer a steadier path to higher highs later in the year, but as you well know, the market doesn’t always give you what you want and can surprise to the upside. If a melt-up or “irrational exuberance” should surface, heightened volatility would likely accompany it, and we would need to reassess at that time.
What About Valuation and Our P/E Assumptions?
The major pushback we get in our price-level targets is our valuation assumptions. The 19 to 20 times P/E levels we expect feel high to some folks. To that end, I’d like to first point out that throughout history, we have seen P/E levels remain above the long-term average when inflation is moving in the right direction and the fundamentals remain solid…as they are today. If you don’t believe that, check out the 1950s, the 1980s, the mid-1990s and the post-2007/08 recovery periods.
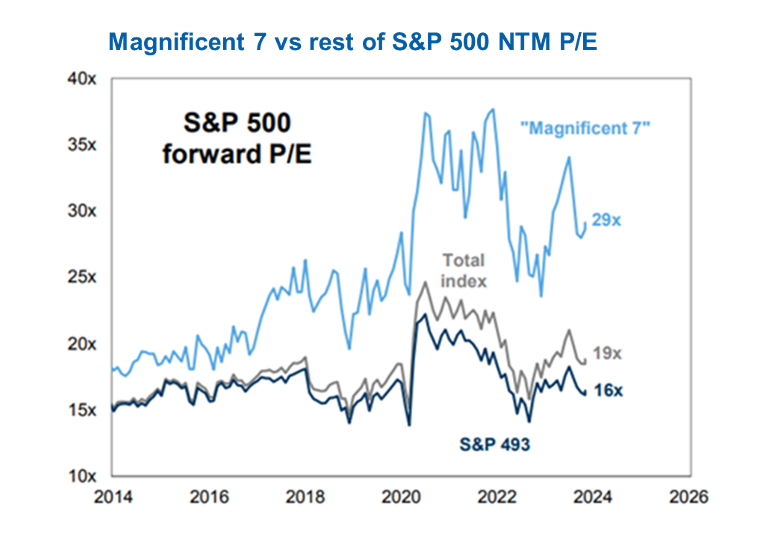
As important, as an active manager, we find P/E levels quite attractive in a large portion of the S&P 500 stock universe. The chart below illustrates this. The 19 times overall P/E ratio is distorted by the fact that the Magnificent 7 are trading at 30 times earnings and are over a third of the value of the Index. However, at the same time, 493 stocks trade at an average P/E level of 16 times earnings with a number of stocks in that group trading at below that 16 times average. We’d much rather see 493 out of 500 stocks trading at reasonable multiples while a handful look elevated versus the other way around. And while the Magnificent 7 trade at 30 times earnings versus the rest at 16, let me repeat that the former has an expected earnings-per-share growth rate double that of the Index in 2024…in other words, double the P/E but double the growth rate. Seems reasonable.
Wall of Worry – What Are the Key Issues in 2024?
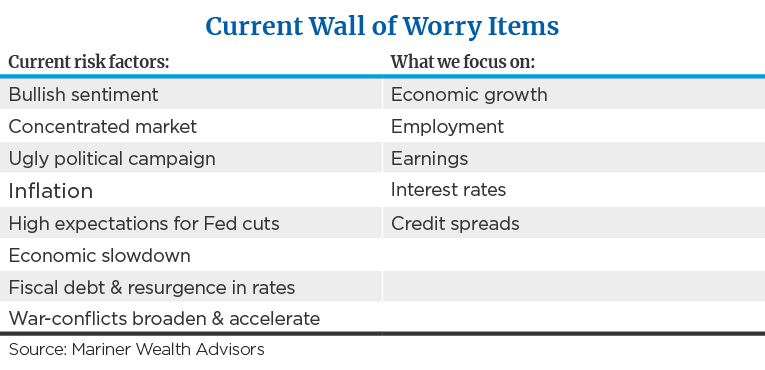
In 2023, concerns centered on worries that we’d see hyperinflation like that of the 1970s and a Fed rate hike-induced economic recession that would drive a plunge in earnings. As we anticipated, none of this happened. These three major concerns above—risk of runaway inflation, painful recession and a major Fed policy mistake—are largely resolved in our mind, and enough progress has been made to move them to the very bottom of the list of major risks to monitor in 2024. They’ll linger in the headlines for a while but are seasoned/understood risks unlikely to generate the worst-case outcomes that were feared only a few months ago.
The two major items that we think will be in the headlines to spook investors this year are rhetoric about über-bullish investor sentiment and the potential fallout from concentrated market returns, as we have referenced above. And, of course, politics…what about the presidential election?
- Is Sentiment Too Bullish? Investors are pondering whether sentiment is too giddy and therefore fear that the S&P 500 is poised to fall. I am often asked, “Jeff, how can the S&P 500 repeat with solid results in 2024 after the 26.3% return it posted last year?” In answer to this, I suggest studying history. The chart below illustrates that annual returns of 20% or greater are by far the most common return category for the S&P 500 going back to 1926. The next most common annual return category during this long period is gains of 10% to 20%. Importantly, there are a number of years of consecutive 20% gains or instances of a 10% to 20% return year followed by a year with equal result.Rarely does the market lose money. These loss years are concentrated in the horrible economies of the 1930s and 1940s, the 1970s and, of course, the challenging early 2000s. Unlike today, the fundamentals of the economy and stock market at these moments in history were trending in a terrible direction, and these bear markets are separated by bountiful decades in between them. So, just because we had a strong year in 2023 doesn’t mean the S&P 500 is doomed in 2024, particularly with the positive, back to normal fundamental catalysts and metrics we see supporting the market. Further, the 26% return in 2024 just made us whole from the 20% loss in 2023.

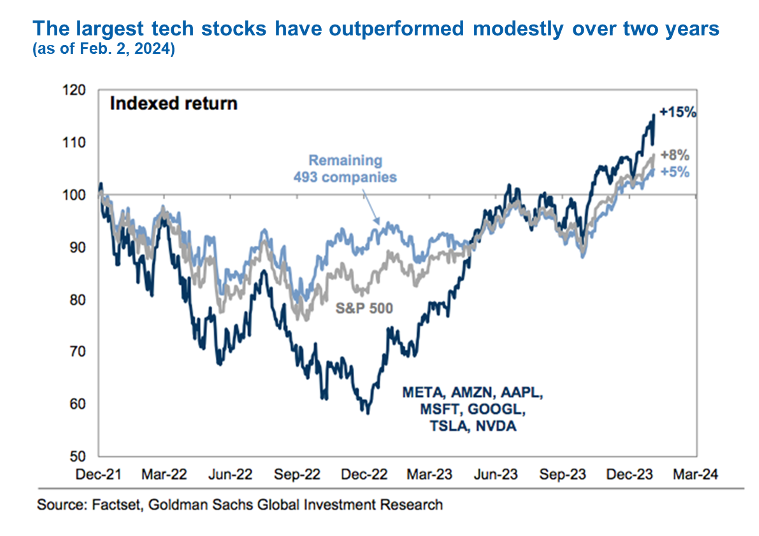
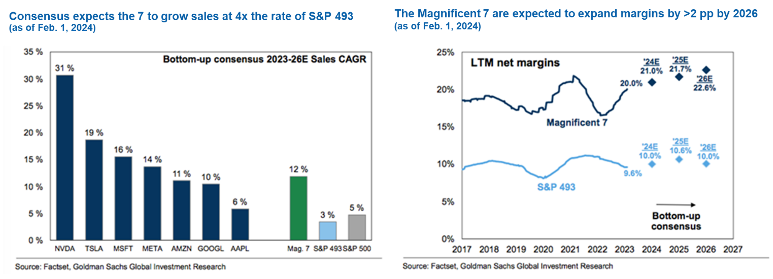
- Putting This Concentrated Market Rhetoric Into Perspective. As they say, a picture is worth a thousand words. The first graph below shows that when looking at the cumulative returns for the Magnificent 7 versus the rest of the market for the period covering January 1, 2022, through early 2024, cumulative performance isn’t all that different. Yes, the Magnificent 7’s are higher, but their cumulative returns are far closer to the pack than advertised. The second chart shows that this reasonable level of outperformance is driven by their superior revenue growth and trends in profitability. In other words, it’s warranted.
- Politics. We’ll save the bulk of this discussion for later in the year. For now, I would note that the average return in reelection years is roughly 16% going back to the 1930s. This happens to be a reelection year with an incumbent running against a veteran candidate as well, not an open election year with a couple of unknown rookies battling it out. The campaign may be ugly, but we know incumbents can use the power of the purse to stimulate the economy and to try to make sure there is no recession prior to Election Day. There is plenty of stimulus out there, and that is good for earnings. In addition, knowing the candidates reduces uncertainty with voters as to their likely policy stances and likely agendas. We might not like them, but just knowing what the risks are eases our angst. The bottom line is that reelection years are preferable to open election years and generally okay regardless of who wins.
Wrap-Up
Per usual, we think the wall of worry risks regarding sentiment and concentration risk are exaggerated. As for politics, elections cause temporary volatility, but it’s fundamentals that drive returns. There’s a reason why our equity investment process is grounded in FVTs (Fundamentals, Valuation and Technicals) not FVT&Ps (that includes politics), as we like to say. We’ll continue to monitor the headline risks to see if we detect spillover into the FVTs. As it stands now, the FVTs look neutral to positive as does our stance on the market and underlies our recommendation to stay fully invested in stocks at normal long-term targets.
Sources:
11999: Behind the Prince Song That Started a New Era in Pop Music
2Strategas
3,4,5FactSet
The S&P 500 Index is a market capitalization-weighted index of 500 stocks designed to represent the performance of the leading industries in the United States economy chosen for market size and industry group representation. S&P 500 Equal Weight Index is designed to track the equally weighted performance of the 500 constituents in the S&P 500 Index. The indexes mentioned herein are unmanaged and cannot be directly invested into. Past performance is no indication of future results. Investing involves risk and the potential to lose principal.
This commentary is for informational and educational purposes only. The views expressed are for commentary purposes only and do not take into account any individual personal, financial, or tax considerations. As such, the information contained herein is not intended to be personal legal, investment, or tax advice or a solicitation to buy or sell any security or engage in a particular investment strategy. Nothing herein should be relied upon as such, and there is no guarantee that any claims made will come to pass.
Any opinions and forecasts contained herein are based on the information and sources of information deemed to be reliable, but we do not warrant the accuracy of the information that any opinion or forecast is based upon. You should note that the materials are provided “as is” without any express or implied warranties. Opinions expressed are subject to change without notice and are not intended as investment advice or to predict future performance. Actual results or developments may differ materially from those projected. Consult your financial professional before making any investment decision.
Mariner Advisor Network is a brand utilized by Mariner Independent Advisor Network (“MIAN”) and Mariner Platform Solutions (“MPS”). Investment advisory services are offered through Investment Adviser Representatives registered with MIAN or MPS, each an SEC registered investment adviser. Registration as an investment adviser does not imply a certain level of skill or training. MIAN and MPS comply with the current notice filing requirements imposed upon registered investment advisers by those states where they transact business and maintain clients. MIAN and MPS have either filed notice or qualify for an exemption or exclusion from notice filing requirements in those states. Any subsequent, direct communication by MIAN or MPS with a prospective client shall be conducted by a representative that is either registered or qualifies for an exemption or exclusion from registration in the state where the prospective client resides. For additional information about MIAN or MPS, including fees and services, please contact MIAN/MPS or refer to the Investment Adviser Public Disclosure website (www.adviserinfo.sec.gov). Please read the disclosure statement carefully before you invest or send money.
For information about which firm your advisor is registered with, please refer to the Investment Adviser Public Disclosure website (www.adviserinfo.sec.gov) or the Form ADV 2B provided by your advisor.
Investment Adviser Representatives are independent contractors of MPS or MIAN and generally maintain or affiliate with a separate business entity through which they market their services. The separate business entity is not owned, controlled by, or affiliated with MPS or MIAN and is not registered with the SEC. Please refer to the disclosure statement of MPS or MIAN for additional information.