


Following midterm elections, November 2022 was good to investors, which tracks with historical post-election norms. The tech-laden Nasdaq rose nearly 5.5% for the month and both the S&P 500 and the Dow Jones Industrial Average rose almost 6% in the 30-day period.1
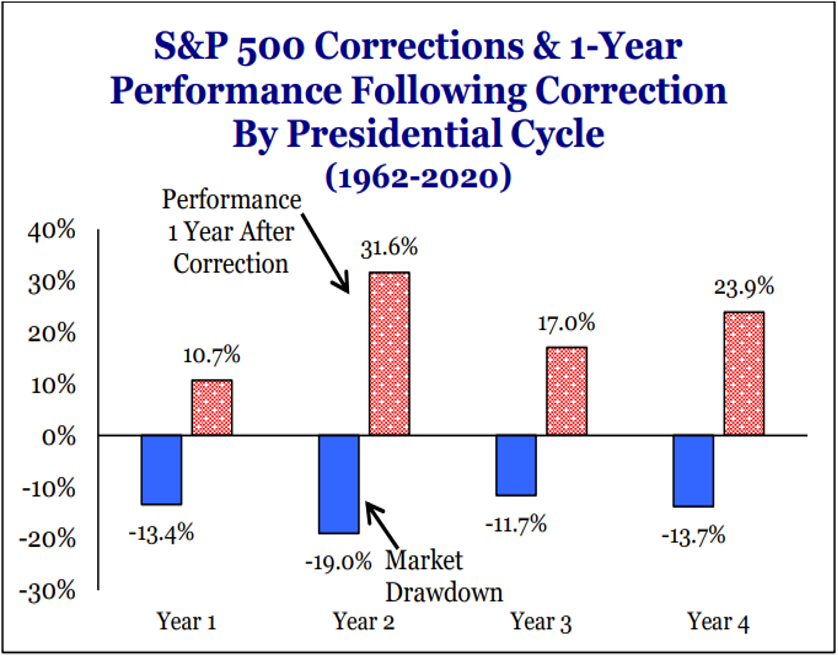
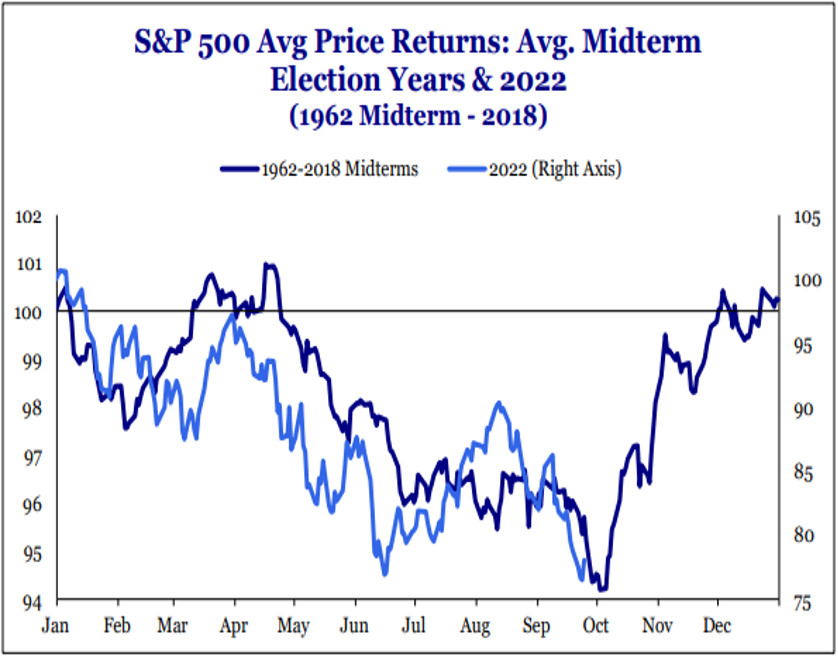
As we noted in last month’s commentary, the market tends to trade down through the first 10 months of midterm election years according to data going back to 1962, with some type of larger-than-normal correction within that period, but then U.S. stocks tend to rally handsomely in the final two months of the calendar year. Stocks then typically continue to advance nicely over the ensuing 12 months following the completion of the political season. One seldom should use the word “never” in this industry, but the data is quite compelling on this point. The S&P 500 has never posted negative returns for the one-year period following a midterm election, post-1942. The charts below illustrate this intriguing trading pattern.
Source: Strategas
A Split Congress Calms Investors’ Uncertainty
We’ll oversimplify, but the logic behind this election cycle seasonality and price trend is straightforward. Investors don’t like the leadership changes and policy shifts that are feared during the final 10 months of the election season. However, regardless of who wins the political battle, investors historically have demonstrated a habit of regaining confidence in the economy/financial markets once they know the answer. In fact, when Congress is divided, investors can once again focus on fundamentals and valuation levels. These are the factors that truly drive earnings and stock prices after the election battles end. Usually, these financial market metrics are trending in a better direction. Investors cheer this realization in the final months of the midterm election cycle year and on into the following calendar year. We believe this midterm year may be quite similar to the others in this regard. While exciting stock price returns may not be immediate, we look for the S&P 500 to begin to show signs of improvement as 2023 develops.
Positive Outlook Despite Slowing Economy
Our positive outlook for the financial markets for 2023 holds despite our observation that the economy may be slowing and could even be moving toward a mild recession given the measurable increase in interest rates that the Federal Reserve has already engineered. Yet, as supply chain issues continue to ease and employment levels remain healthy, we envision an environment where demand slows in relatively measured fashion from an unsustainable, liquidity-driven, V-shaped, post-pandemic surge, enabling corporate earnings growth to simply moderate versus crater like they have in ugly, more credit-driven deep recessions such as 2007/2008, the late 1970s to early 1980s and the 1920s to 1930s.
As inflation continues to calm as it has over the past several months, we believe it will allow the Fed to reduce the pace and the magnitude/peak target of future rate increases. This, in turn, should enable P/E multiples to expand slightly from the 15 times level they have fallen to at recent troughs in the S&P 500 in August and October up to the 18-19 times level (still below the 22 times peak P/E levels we saw back in January 2022).2 This higher but reasonable P/E ratio on consensus forward earnings estimates should support S&P 500 price levels of 4,800 or above over the next 12-15 months. More to come on the details in our January Crystal Ball outlook for 2023.
Odds of Recession Rise, But “You Ain’t So Bad” So Far
This is a phrase that the character Rocky Balboa often said to his opponents in those well- choreographed boxing scenes. It aptly applies to describing the economy right now as well. It’s hard to say that 3.7% unemployment is oppressive, right?3 One can make the same conclusion regarding the Fed’s forecast that unemployment may rise to 4.4% at the peak if the Fed pursues its targeted additional rate hikes. This is far below the 10%-20% unemployment rates during the Great Recession or in the 1920s and 1930s.
Consumer Spending Signals Healthy Economy
Consumer spending may be shifting from goods to services as the economy continues to reopen and we’re increasingly returning to work. Spending is still healthy, albeit different from the cocooning days of the pandemic. In fact, the most recent data shows personal consumption growing at an annual clip of more than 8%. The consumer represents roughly 70% of our economy..4 Single-family housing may be extremely soft, but strength in multifamily housing is offsetting weakness in the former. Certainly, softness in housing is not stopping consumers from spending on other items and services. Spending on airlines and lodging are up over 50% and 30%, respectively, on a year-over-year basis through the end of September.5 Third quarter 2022 real GDP grew an upwardly revised 2.9%, and fourth quarter is pacing at 2.8% real growth, per the Atlanta Federal Reserve (nice bounces compared to the first two quarters).5
Per the Fed’s Summary of Economic Projections, it is expecting positive real GDP growth in 2022 and 1% growth in 2023.6 This may be a growth recession, but it sure doesn’t sound like a deep-dark-credit bubble-variety recession. This has been the most telegraphed recession on the planet, yet it remains to be seen if it will happen. Regardless, the market was down 25% from the Jan. 3 peak through mid-October, which matches the average peak-to-trough decline in the market during normal recessions.7 Although more choppiness may occur as data is released, we expect the market has already discounted what a recession decline might look like, and we expect further potential declines to not exceed what we have already experienced.
Inflation Appears Less Worse
To us the key is not whether the economy slows in mild fashion. We are focusing on the trend in inflation and the potential reaction from the Fed—greater-than-expected interest rate increases. Currently, however, it appears inflation is getting less worse, and, in positive fashion, the Fed is noticing. That is just what the market has been looking for.
We were out on the road talking with investors when the consumer price index report was released on Thursday, November 10. We had suggested to some groups we spoke with the day before that they should grab some popcorn and settle in for the report early Thursday morning in their office or family room. If it was less bad/better than feared, we thought the market would rocket on that Thursday. If the data had been disappointing or worse than expected, we anticipated an ugly sell-off. We thought the odds tilted toward the former, as we have seen a number of inflation components begin to calm these last several months. Sure enough, the news was a slight positive surprise as the CPI data for October improved to only “terrible” versus the “horrible” ranking of prior months. Investors cheered as we expected. Nice to see the green that day and a continued indication that inflation data is trending a tad better. Part of the rationale for our S&P 500 target of 4,800 or better in the second half of 2022 was our expectation that inflation will calm enough to allow the Fed to begin to chill and establish end targets for fed funds that are lower than the worst-case outcomes bantered about at present. Based on the comments from various Fed governors, from the movement in the fed funds futures curve and by the bond market (recent decline in yields and still reasonable credit spreads), it looks like we have some esteemed company that shares our thinking following the latest data.
Fed Chair Indicates Soft Landing Possible
Even Fed Chairman Jerome Powell himself is less crabby about inflation as we move into December. On November 30, he made comments that it is time to think about moderating monthly increases in the fed funds rate, noting that there has been significant progress with regard to goods inflation, that price increases in key components, such as new rents and leases, are slowing considerably and that perhaps we are nearing the adequately restrictive zone. He also affirmed he believes a soft landing is still possible in the economy and that he hopes to avoid pushing rates to a point that causes a recession to cure the inflation bug. I don’t think this is the result of some type of recent presentation coaching he has received… it confirms that he is data dependent and since 2018 has proven his willingness to pivot on numerous occasions. Only a month or so ago his mantra was “pain” when describing policy direction in rates and now it is “moderation.” Only time will tell, but this is a positive shift in tone, presumably based on the Fed’s assessment of trends in the recent inflation data. Again, the market is poised in coiled-spring fashion if this becomes more than a slight one or two months’ observation and turns into a consistent monthly trend.
A Historical Perspective on Inflation Peaks
A definitive sign that inflation has peaked is what is necessary for the market to bottom and to advance on a more sustained basis. At least that’s what history teaches us. Check out the data on this. The tables below illustrate this important point.
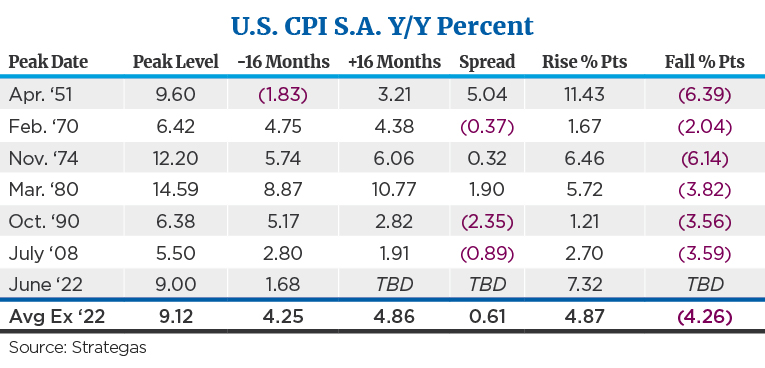
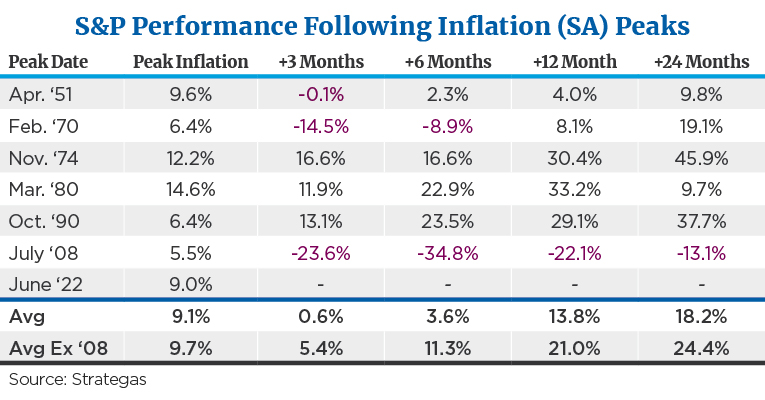
As shown in the tables, there have been six periods of surging inflation post-1950 to today, including peak inflation periods in April 1951; Feb. 1970; Nov. 1974; March 1980; Oct. 1990; July 2008; and June 2022. In each of these periods, inflation was significantly lower, but in most cases, still elevated 16 months after the peak. For example, in November 1974, inflation rose and peaked at a level of 12.2% versus only 6% 16 months prior. Sixteen months, or just slightly over a year after the November 1974 peak of 12.2%, inflation had fallen to a lower but a still historically high level of 6%. Investors might think that the market would have performed poorly at this still elevated rate of inflation, right? That’s one of the bearish arguments today… that even if inflation declines from here, the market won’t like a still higher rate of inflation than we’ve seen for the last several decades. Well, in 1974, the market advanced 30% over the 16 months following that November 1974 peak. On average, in all six of the periods cited above, the market advanced 14% in the 16 months following the peak. The average number increases to a 21% return if you exclude the extremely painful and unusual Great Recession of 2008—and in all periods except 2008, the market generated positive returns in the 16 months after the inflation rate peaked, even if the rate still remained above normal historical averages. History seems to tell us the key is that inflation peaks, not that it returns to where it was!
Wrap-Up: Patience Is Required
While it sure was fun to see the 5.5% advance in the S&P 500 in November and benefit from this 20% rally in the S&P 500 from the mid-October low through early December,7 we still advise clients to hold their ground. Or, as the well-known hedge fund manager and owner of NFL and FC soccer franchises, David Tepper, is quoted as saying, “The key is to wait. Sometimes the hardest thing to do is to do nothing.”
Not Ready to Call “All Clear”
Although many of the above points show the likely positive winds behind the market going into 2023, there are a lot of potential crosscurrents to work through before the “all clear” can be signaled. These include China, Russia, debt ceiling negotiations and so forth. We can’t help but cringe a bit when we read articles noting that we are in a new bull phase in the S&P 500 simply because of this most recent push in the S&P 500 that has cracked the 20% barrier from a low. Somehow, this technical achievement is supposed to mean we are back in bull territory. We’d definitely cheer if the market has bottomed and the bull was back. We’re still well below the 4,796 peak price level achieved back on Jan. 3 of this year. Things have improved, but let’s not get carried away. There are still risks we must navigate during this time of numerous transitions in the economy.
We recommended that clients take time at the beginning of 2022 to rebalance their long term equities allocation if the robust annualized rates of return over the last three years had lifted their stock exposure well above normal levels. Our suggestion was to trim back one’s equity holdings accordingly and stay there, unlike our earlier “buy on the dips” focus in virtually all the pullbacks prior to 2022.
There are just too many transitions that the market needs to digest in our mind (Fed policy, midterm elections, geopolitics, shifting tide from globalization toward deglobalization, inflation trends, etc.) not to exercise more patience and caution this year. We do expect the market to provide a healthy double-digit return over the next 12 months from here and see signs that perhaps it is telling us it has bottomed. That said, we think it is premature to wave the all-clear signal and accelerate one’s pace of putting any excess cash to work or raising the upper band of one’s stock allocation. A couple more data points affirming that inflation has indeed peaked and that the Fed can slow hikes/take a break is needed before we start talking “buy the dip” lingo. In the meantime, we recommend hanging in at normal stock allocations and appreciate the opportunities to add value through active stock selection rather than leaning only on the market indices to drive portfolio returns.
Sources:
1-5 FactSet
6 FactSet and Federal Reserve Bank of Atlanta
7 FactSet
Definitions
The Nasdaq Composite Index is the market capitalization-weighted index of over 3,300 common equities listed on the Nasdaq stock exchange.
The S&P 500 Index is a market-value weighted index provided by Standard & Poor’s and is comprised of 500 companies chosen for market size and industry group representation.
The Dow Jones Industrial Average (DJIA) is an index that tracks 30 large, publicly-owned companies trading on the New York Stock Exchange (NYSE) and the NASDAQ.
Disclosures
This commentary is limited to the dissemination of general information pertaining to Mariner Platform Solutions investment advisory services and general economic market conditions. The views expressed are for commentary purposes only and do not take into account any individual personal, financial, or tax considerations. As such, the information contained herein is not intended to be personal legal, investment or tax advice or a solicitation to buy or sell any security or engage in a particular investment strategy. Nothing herein should be relied upon as such, and there is no guarantee that any claims made will come to pass. Any opinions and forecasts contained herein are based on information and sources of information deemed to be reliable, but Mariner Platform Solutions does not warrant the accuracy of the information that this opinion and forecast is based upon. You should note that the materials are provided “as is” without any express or implied warranties. Opinions expressed are subject to change without notice and are not intended as investment advice or to predict future performance. Consult your financial professional before making any investment decision.
Investment advisory services are provided through Mariner Platform Solutions, LLC (“MPS”). MPS is an investment adviser registered with the SEC, headquartered in Overland Park, Kansas. Registration of an investment advisor does not imply a certain level of skill or training. MPS is in compliance with the current notice filing requirements imposed upon registered investment advisers by those states in which MPS transacts business and maintains clients. MPS is either notice filed or qualifies for an exemption or exclusion from notice filing requirements in those states. Any subsequent, direct communication by MPS with a prospective client shall be conducted by a representative that is either registered or qualifies for an exemption or exclusion from registration in the state where the prospective client resides. For additional information about MPS, including fees and services, please contact MPS or refer to the Investment Adviser Public Disclosure website (www.adviserinfo.sec.gov). Please read the disclosure statement carefully before you invest or send money.
Investment Adviser Representatives (“IARs”) are independent contractors of MPS and generally maintain or affiliate with a separate business entity through which they market their services. The separate business entity is not owned, controlled by, or affiliated with MPS and is not registered with the SEC. Please refer to the disclosure statement of MPS for additional information.
Indexes are unmanaged and cannot be directly invested into. Past performance does not guarantee future results. Investing involves risk and the potential to lose principal. Consult your financial professional before making any investment decision.