


“There’s something happening here…but what it is ain’t exactly clear.” – Lyrics from the countercultural classic song, “For What It’s Worth,” by Buffalo Springfield
After a stellar first six months for the S&P 500 in which it posted a return of over 15%, placing this index’s year-to date results through June 30 in the top 15 first halves on record, it’s off to a good start in the second half as well. In July, the S&P 500 advanced roughly 2.3%…not bad for one month’s worth of work.1 The chart illustrates that, based on history, it’s not unusual at all for good times to continue in the balance of the year after a robust first half for the index.
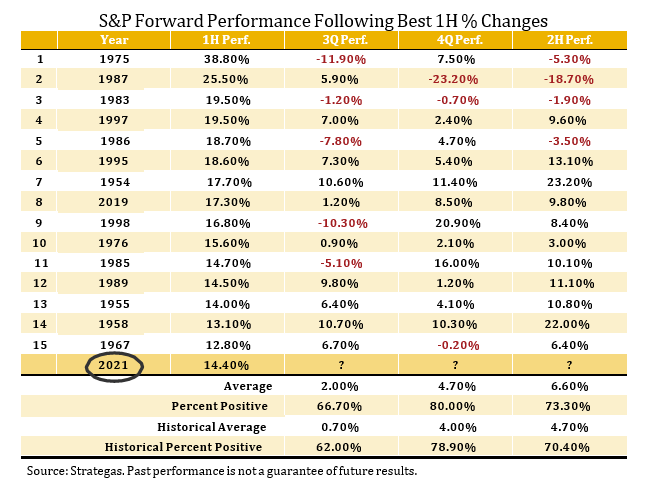
Specifically, the chart shows that six-month forward returns following the top 15 first-half performances for the S&P 500 on record average 6.6% and are positive 73% of the time. So, the nice start to 2021’s second half in July is in keeping with this good news. And yet, this uninterrupted,
robust advance we have witnessed in the S&P 500, following the severe pandemic-induced correction of more than 30% in March of 2020, begs the question that is on investors’ minds: Can this rally continue? After all, we have gone over nine months without a pullback of more than 5% in the market, and volatility remains subdued.2 In our mid-year crystal ball update that we just published last month, we were pretty clear on our thoughts. We expect healthy returns over the next twelve months but would not be surprised to see a pause or correction in the S&P 500 before moving to higher highs of 4650 or above by mid-2022.
In fact, despite the S&P 500 moving to new highs in July, we already see signs of corrective action in the equity markets that we believe set the stage for healthy results looking out over the next year.
Our observations of some of this healthy rotational behavior in the market under the surface brought to mind the lyrics from Buffalo Springfield’s 1960s hit song. There is something going on here in the market that appears transitional in nature. While it might not be entirely clear, we do believe it is healthy. It also inspires our message of maintaining a balanced mix of growth and value in portfolios as the market experiences some of this heightened churn. More to come on this rotational behavior and what it means for investors…
Under the Hood of the S&P 500 and Rolling Corrections at the Sector Level
Additional lyrics in the Buffalo Springfield song go on to say: “Hey, what’s that sound…everybody look what’s going down.” As the song suggests, it is important to stop and look below the surface to better understand this very interesting environment. We see some productive signals the market is sending when looking under the hood of several S&P 500 indices. While the headlines imply there is froth and bubbles and that this advance is too clean and uninterrupted, we see other signs of healthy near-term skepticism that can keep a market advancing in the intermediate and longer term.
Everyone may not be familiar with the fact that the S&P 500 is a market cap weighted index. By that I mean that an individual stock’s contribution to the S&P 500 Index return is weighted by its size or market capitalization—defined as the stock price of a company multiplied by its number of shares outstanding. The largest companies in a benchmark constructed in this fashion, therefore, have much more influence on the Index return than smaller companies in the Index. Microsoft for example, which has a market capitalization of over $2 trillion, is much more impactful to index performance than General Motors with a market capitalization of only $80 billion in this construct.
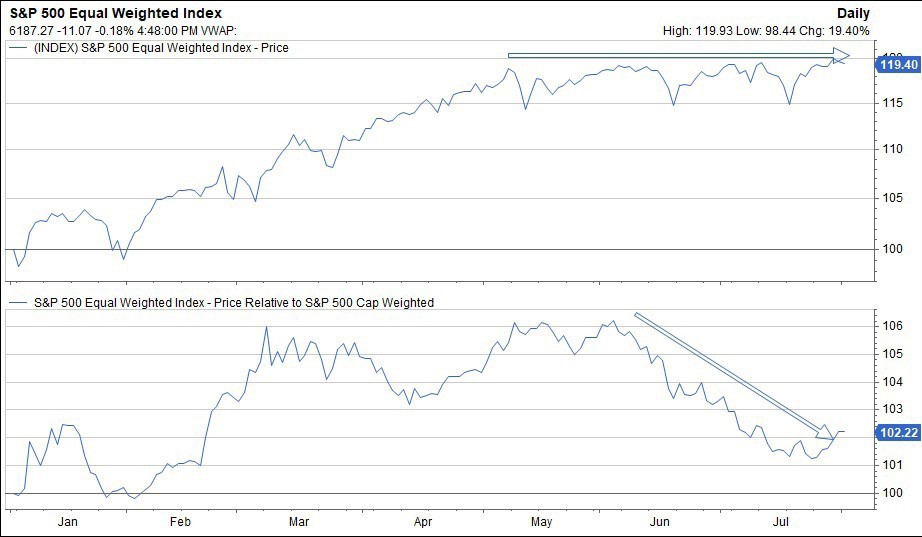
So, when we say the S&P 500 posted over a 15% return in the first half of 2021, it is this well-known market cap weighted index we are talking about. There is another way to calculate S&P 500 returns and that is by equally weighting each company in the index. This is referred to as the Equal Weighted S&P 500. In this benchmark, each company’s stock carries equal importance in determining the total value of the Index and contribution to Index return. We look at both of these indices to get a clearer picture of what is really going on in the market. Interestingly at present, while the market cap weighted index is hitting new highs, the equal weighted S&P 500 is moving sideways and not moving to record highs. The chart captures the difference in the paths of these two benchmarks. This is a signal that the average stock is not advancing as swiftly as the market cap weighted index implies and is a signal to us that some healthy corrective activity is already occurring.
Other examples at the sector level include energy and financials. In July, energy stocks declined in price by more than 8% compared to the 2.3% return for the S&P 500 for the month. Financials also posted negative price returns in July. It was strong performance in areas such as technology and healthcare that kept the index in positive return territory with returns of 3.8% and 4.7%, respectively, for the month. Similarly, small cap stocks were off 3.6% in July, and emerging market international stocks declined in price by over 6%. Earlier in the year, the Nasdaq corrected more than 10% from its highs.3 The point is clearly that everything is not turning up roses in equity indices.
Perhaps we’ll simply see rolling, rotational corrections in various equity asset classes and in certain S&P 500 sectors in the second half rather than a broad correction in the overall index. Either way, we see this as a healthy sign that investors remain discriminant and the perceived froth in the land of stocks is misunderstood. This activity should set the stage for further advancement in stocks as we move through the next 12 months. This also makes the case that maintaining balance and a productive blend of both value and growth stocks in a portfolio is appropriate during this temporary period of rotation and chop.
Continue to Focus On the Fundamentals, Valuation Levels and Technical Price Trends
Despite our sense that the market is signaling to us that it wants to take a pause here before moving to higher highs through mid-2022, we remain positive over the next 12 months because the fundamental, valuation and technical (F, V, T’s) data remain positive. The economy continues to grow at a healthy level, and earnings continue to be revised upward while rates are low, credit markets are stable, and the Federal Reserve remains accommodative…this is a positive cocktail for stocks. Yes, we are seeing pullbacks in certain sectors and certain equity asset classes, but this is occurring while the F, V, T’s remain positive, and stocks remain in long-term uptrends. Wall of worry items, such as speculation about whether inflation is transitory or more sticky, may cause psychology shifts and temporary investor angst, but bull markets end when the data turns negative and that is not the case today.
Sources:
1,2,3 FactSet
The S&P 500 Index is a market-value weighted index provided by Standard & Poor’s and is comprised of 500 companies chosen for market size and industry group representation.
This commentary is limited to the dissemination of general information pertaining to Mariner Platform Solutions’ investment advisory services and general economic market conditions. The views expressed are for commentary purposes only and do not take into account any individual personal, financial, or tax considerations. As such, the information contained herein is not intended to be personal legal, investment or tax advice or a solicitation to buy or sell any security or engage in a particular investment strategy. Nothing herein should be relied upon as such, and there is no guarantee that any claims made will come to pass. Any opinions and forecasts contained herein are based on information and sources of information deemed to be reliable, but Mariner Platform Solutions does not warrant the accuracy of the information that this opinion and forecast is based upon. You should note that the materials are provided “as is” without any express or implied warranties. Opinions expressed are subject to change without notice and are not intended as investment advice or to predict future performance. Past performance does not guarantee future results. Consult your financial professional before making any investment decision.
Investment advisory services provided through Mariner Platform Solutions, LLC (“MPS”). MPS is an investment adviser registered with the SEC, headquartered in Overland Park, Kansas. Registration of an investment advisor does not imply a certain level of skill or training. MPS is in compliance with the current notice filing requirements imposed upon registered investment advisers by those states in which MPS transacts business and maintains clients. MPS is either notice filed or qualifies for an exemption or exclusion from notice filing requirements in those states. Any subsequent, direct communication by MPS with a prospective client shall be conducted by a representative that is either registered or qualifies for an exemption or exclusion from registration in the state where the prospective client resides. For additional information about MPS, including fees and services, please contact MPS or refer to the Investment Adviser Public Disclosure website (www.adviserinfo.sec.gov). Please read the disclosure statement carefully before you invest or send money.
Investment Adviser Representatives (“IARs”) are independent contractors of MPS and generally maintain or affiliate with a separate business entity through which they market their services. The separate business entity is not owned, controlled by or affiliated with MPS and is not registered with the SEC. Please refer to the disclosure statement of MPS for additional information.